
Once a sample is submitted to dxAquaria, the sample undergoes a controlled in-house workflow from sample cataloging through result.
First, the sample is cataloged within our internal system to make sure all information is traceable. The sample is then processed to release and purify all collected DNA through standard DNA extraction protocols.
Purification is necessary to remove all DNA-degrading enzymes and unwanted compounds (PCR inhibitors, etc) to ensure sample stability and consistency. Once purified, the sample is ready to be tested.
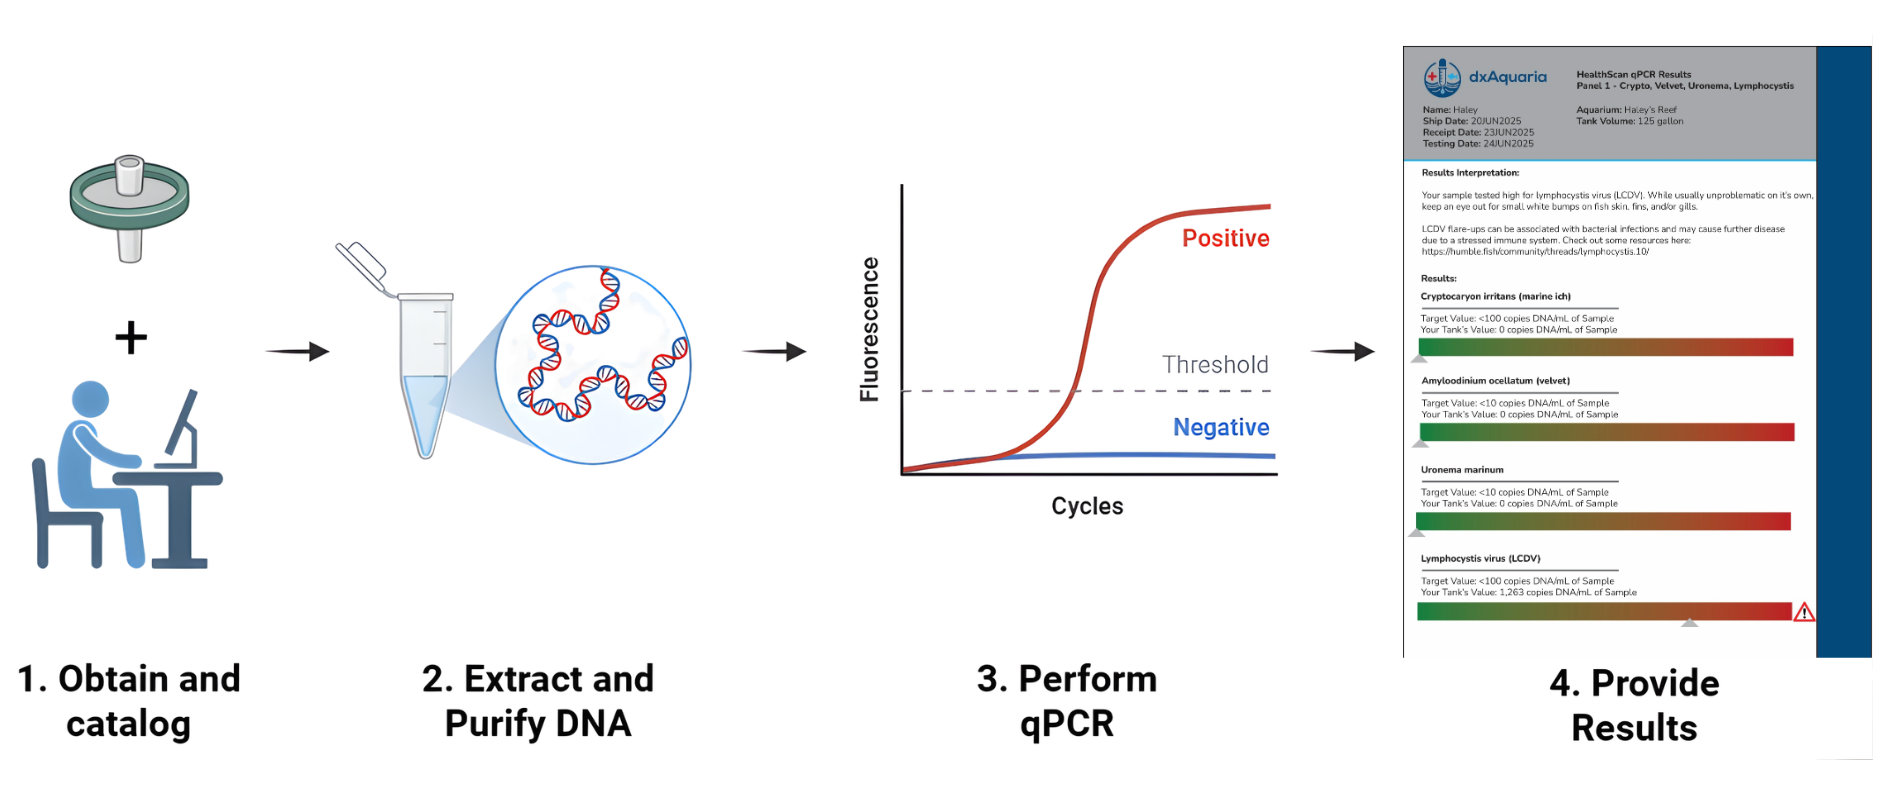
A portion of the sample is then combined with all necessary primers and probes in a qPCR “master mix” containing all necessary components for DNA amplification and quantitation. All client samples are run alongside positive and negative controls to ensure the assay performs as expected.
Finally, the client sample results are compared to the controls from the same run, and a final concentration is calculated against a standard curve if any pathogen DNA was detected.
This document serves as a technical characterization of our first RUO* qPCR panel that detects DNA belonging to four common marine vertebrate pathogens: Cryptocaryon irritans (marine ich), Amyloodinium ocellatum (marine velvet), Uronema marinum, and Lymphocystis disease virus.
Below is an in-depth look into in silico accuracy assessments and overall assay performance (qPCR efficiency, R2, linear range, and limit of detection).
An important aspect of test development is the overall accuracy of the test. All tests designed at dxAquaria begin with in silico analyses.
In silico is a term that means “computer simulated.” Using advanced software that accesses national and international databases, genomic DNA sequences are aligned to each other to find areas of high similarity.
These areas of high consensus are used as “regions of interest” (RoI) for primer design and comparison of previously published work. The overall alignments of each are also used to ensure assay inclusivity or to ensure that the test detects the specific sequence(s).
The first dxAquaria qPCR testing panel targets Cryptocaryon irritans (marine ich), Amyloodinium ocellatum (marine velvet), Uronema marinum, and Lymphocystis disease virus type 1. Being four of the most common disease-associated organisms in marine fish, it is critical to ensure all available genomic sequences are detected with our assay. The inclusivity assessment for the panel is as follows:
| Cryptocaryon irritans | Amyloodinium ocellatum | Uronema marinum | Lymphocystis disease virus | |
| Available Sequences | 23 | 24 | 70 | 69 |
| RoI Detected | 23 | 24 | 70 | 69 |
| Percent Coverage | 100% | 100% | 100% | 100% |
While accurate inclusivity is important, exclusivity is equally or more important. If the test does not successfully exclude undesirable DNA targets, then these closely related off-target organisms can cause false positive results for the desired target. According to NCBI databases, the dxAquaria panel shown above has no predicted off-target amplicons. By the data presented here, the designed panel was predicted to detect the desired targets without fear of false positives due to off-target detection.
Assay performance metrics are measured by a few main metrics: linearity, efficiency, and limit of detection.
Linearity refers to the relationship of measured metric against a known input according to a linear regression (y=mx+b) with “perfect” linearity being a R² value of 1.000.
Efficiency, on the other hand, is a qPCR-specific qualifier that is used to compare ideal performance against what is observed.
Efficiency is calculated using the equation:
Efficiency (E %) = [10(-1/slope)-1]x100%
Efficiencies between 90–110% are indicative of a well-performing assay across the tested analyte concentration.
To measure assay performance, DNA from the corresponding microbe was added to qPCR mixes at known concentrations, and the resulting Ct (cycle threshold; the cycle at which the signal passes a set threshold) was plotted against the input concentration of DNA in solution
(copies/microliter; cps/μL).
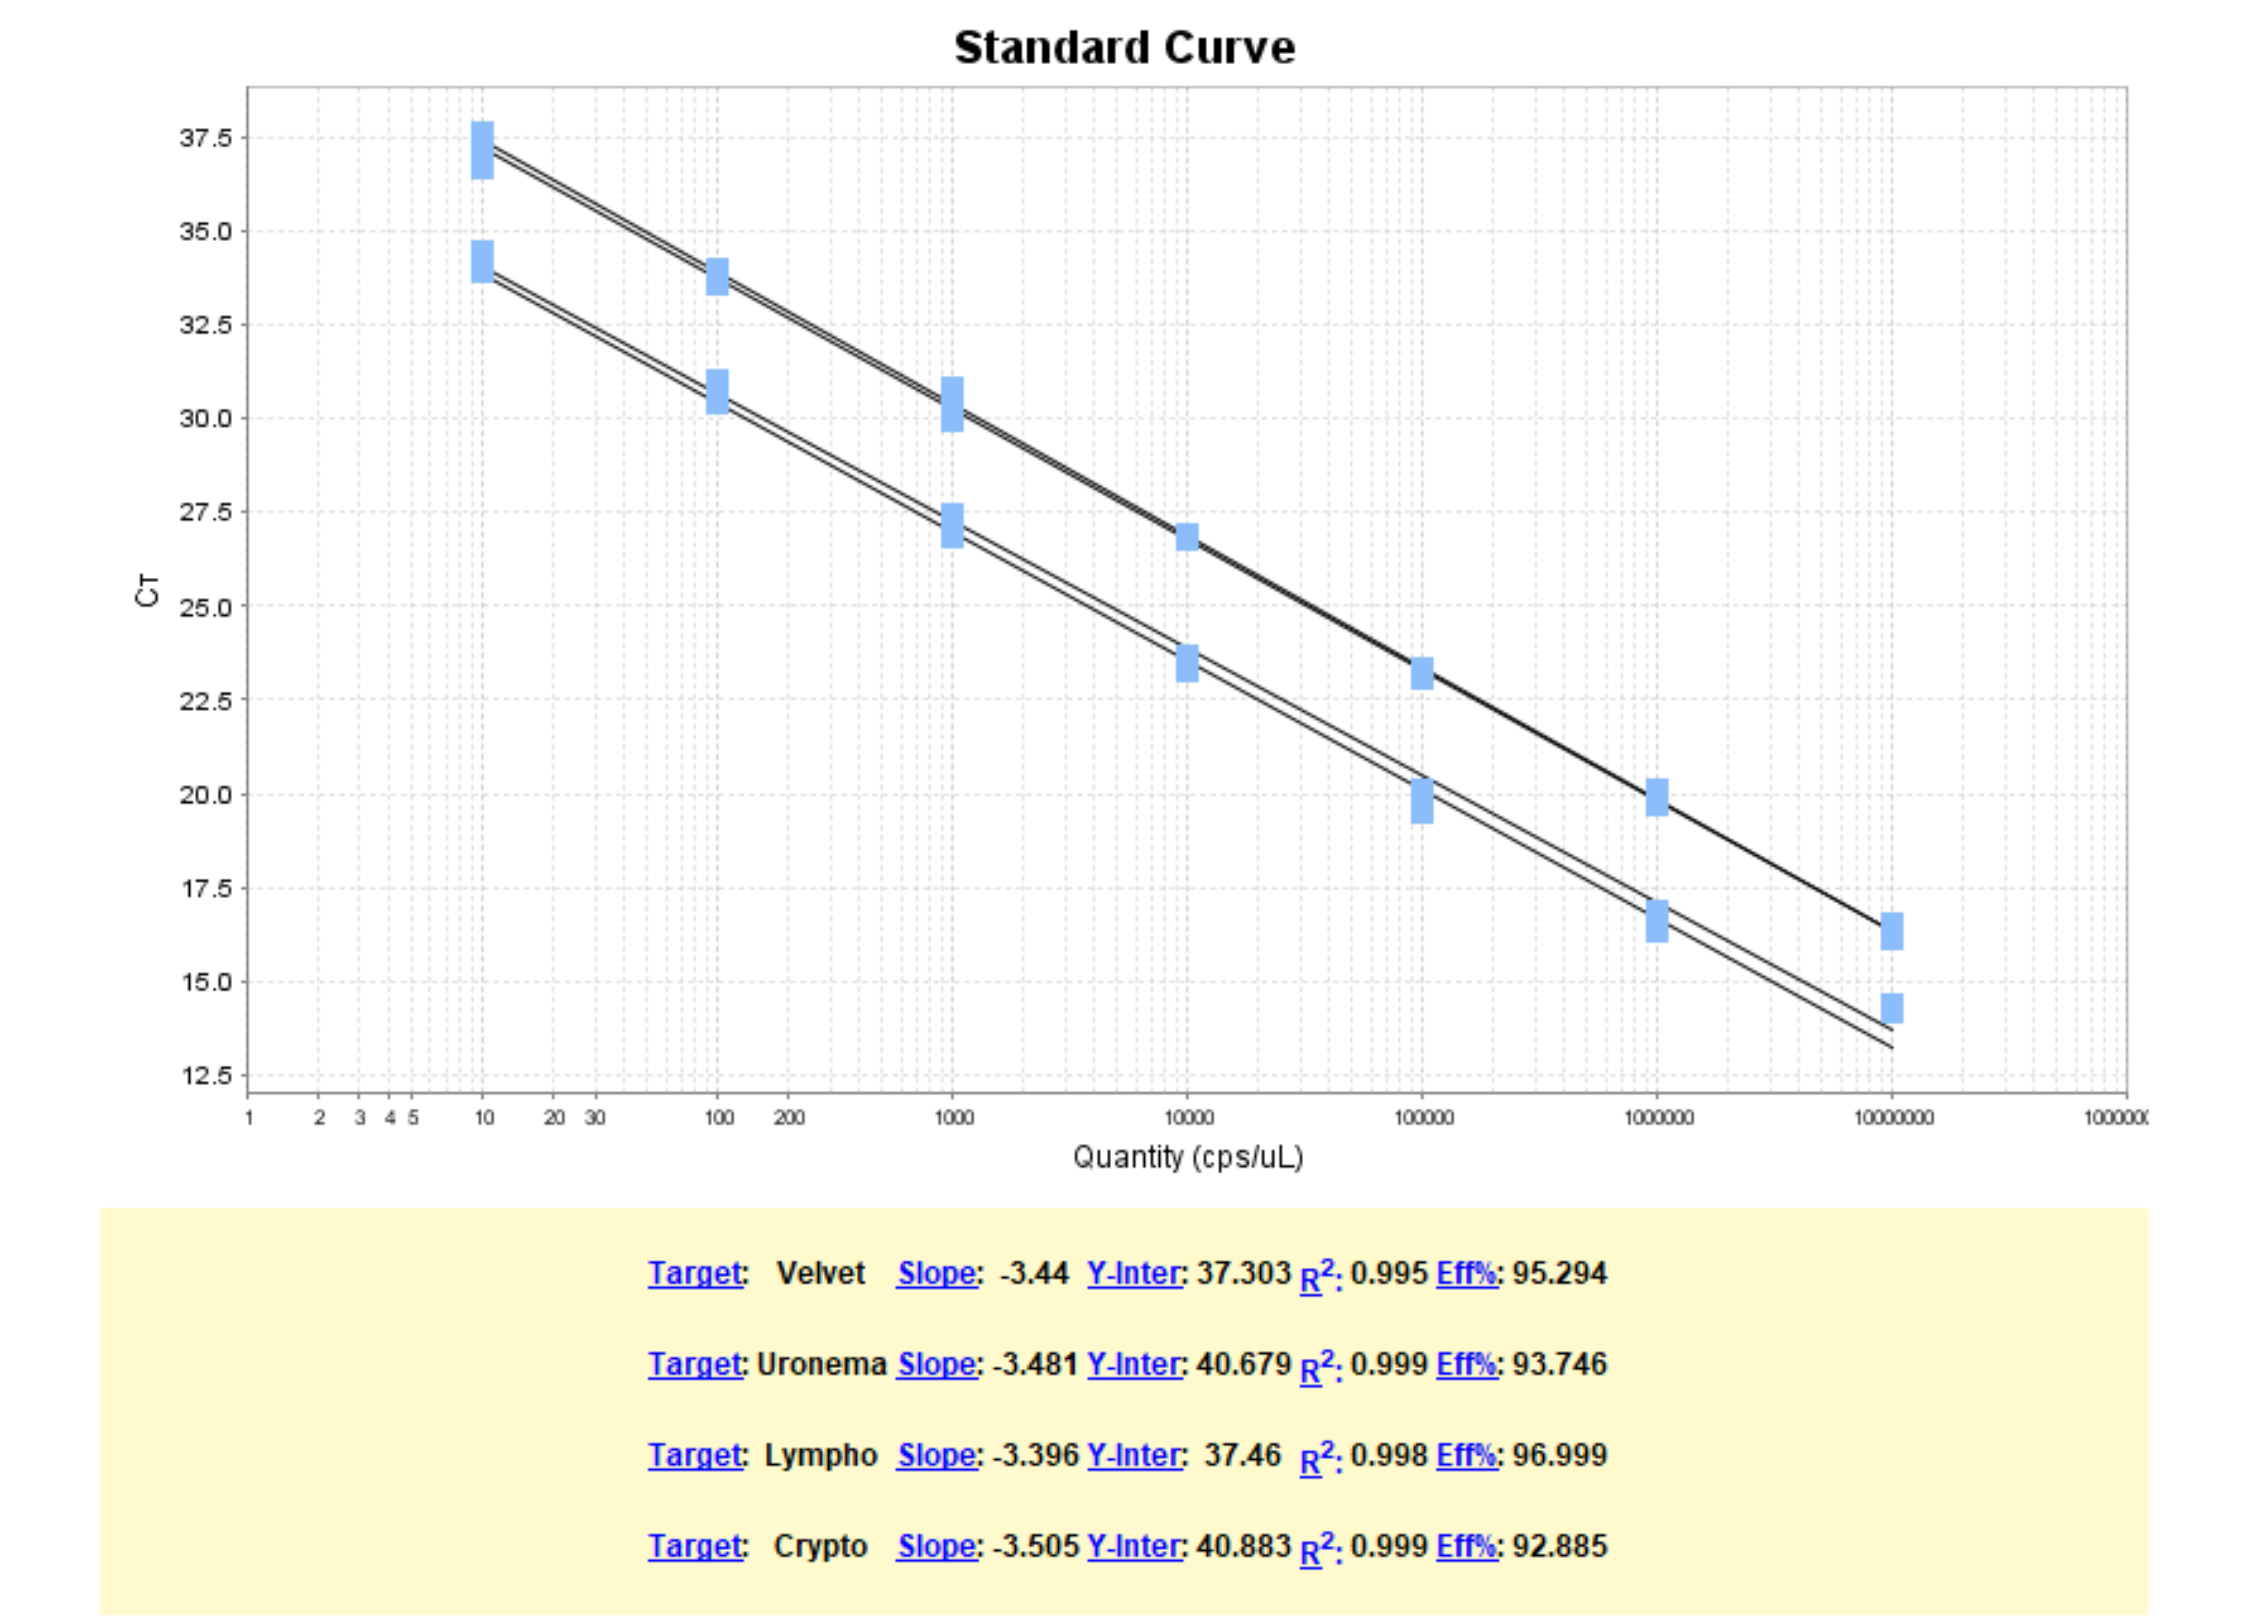
| Target | Linearity (R²) | Efficiency | Linear Range (cps/µL) | Limit of Detection (LoD) |
| Amyloodinium (velvet) | 0.995 | 95.3% | 10 – 10,000,000 | 1 cps/µL |
| Uronema marinum | 0.999 | 93.7% | 10 – 10,000,000 | 10 cps/µL |
| Lymphocystis (LCDV-1) | 0.998 | 97.0% | 10 – 10,000,000 | 1 cps/µL |
| Cryptocaryon irritans | 0.999 | 92.9% | 10 – 10,000,000 | 10 cps/µL |
While this document uses the referenced qPCR panel as a surrogate case-study for assay performance and relevance, all qPCR tests developed at dxAquaria are held to the same level of analytical rigor.
To learn how to interpret your qPCR results, read this article.
For more references, feel free to reach out to the team via email at contactus@dxaquaria.com.
For Surveillance and Informational Use Only. Not for Clinical Diagnosis.
dxAquaria’s qPCR and rapid tests are designed for the detection and quantification of microbial DNA/RNA from environmental samples for surveillance and informational purposes. These tests have not been validated or approved by the USDA or any other regulatory or veterinary governing body.
The results provided ARE NOT a clinical diagnosis of disease. They are intended to be used as a screening and monitoring tool to be interpreted by a qualified professional. All diagnostic and treatment decisions must be made in consultation with a licensed veterinarian who can assess the results in the context of clinical signs and other diagnostic evidence. dxAquaria and its partners assume no liability for actions taken or decisions made based on these test results alone.